Customer Portal
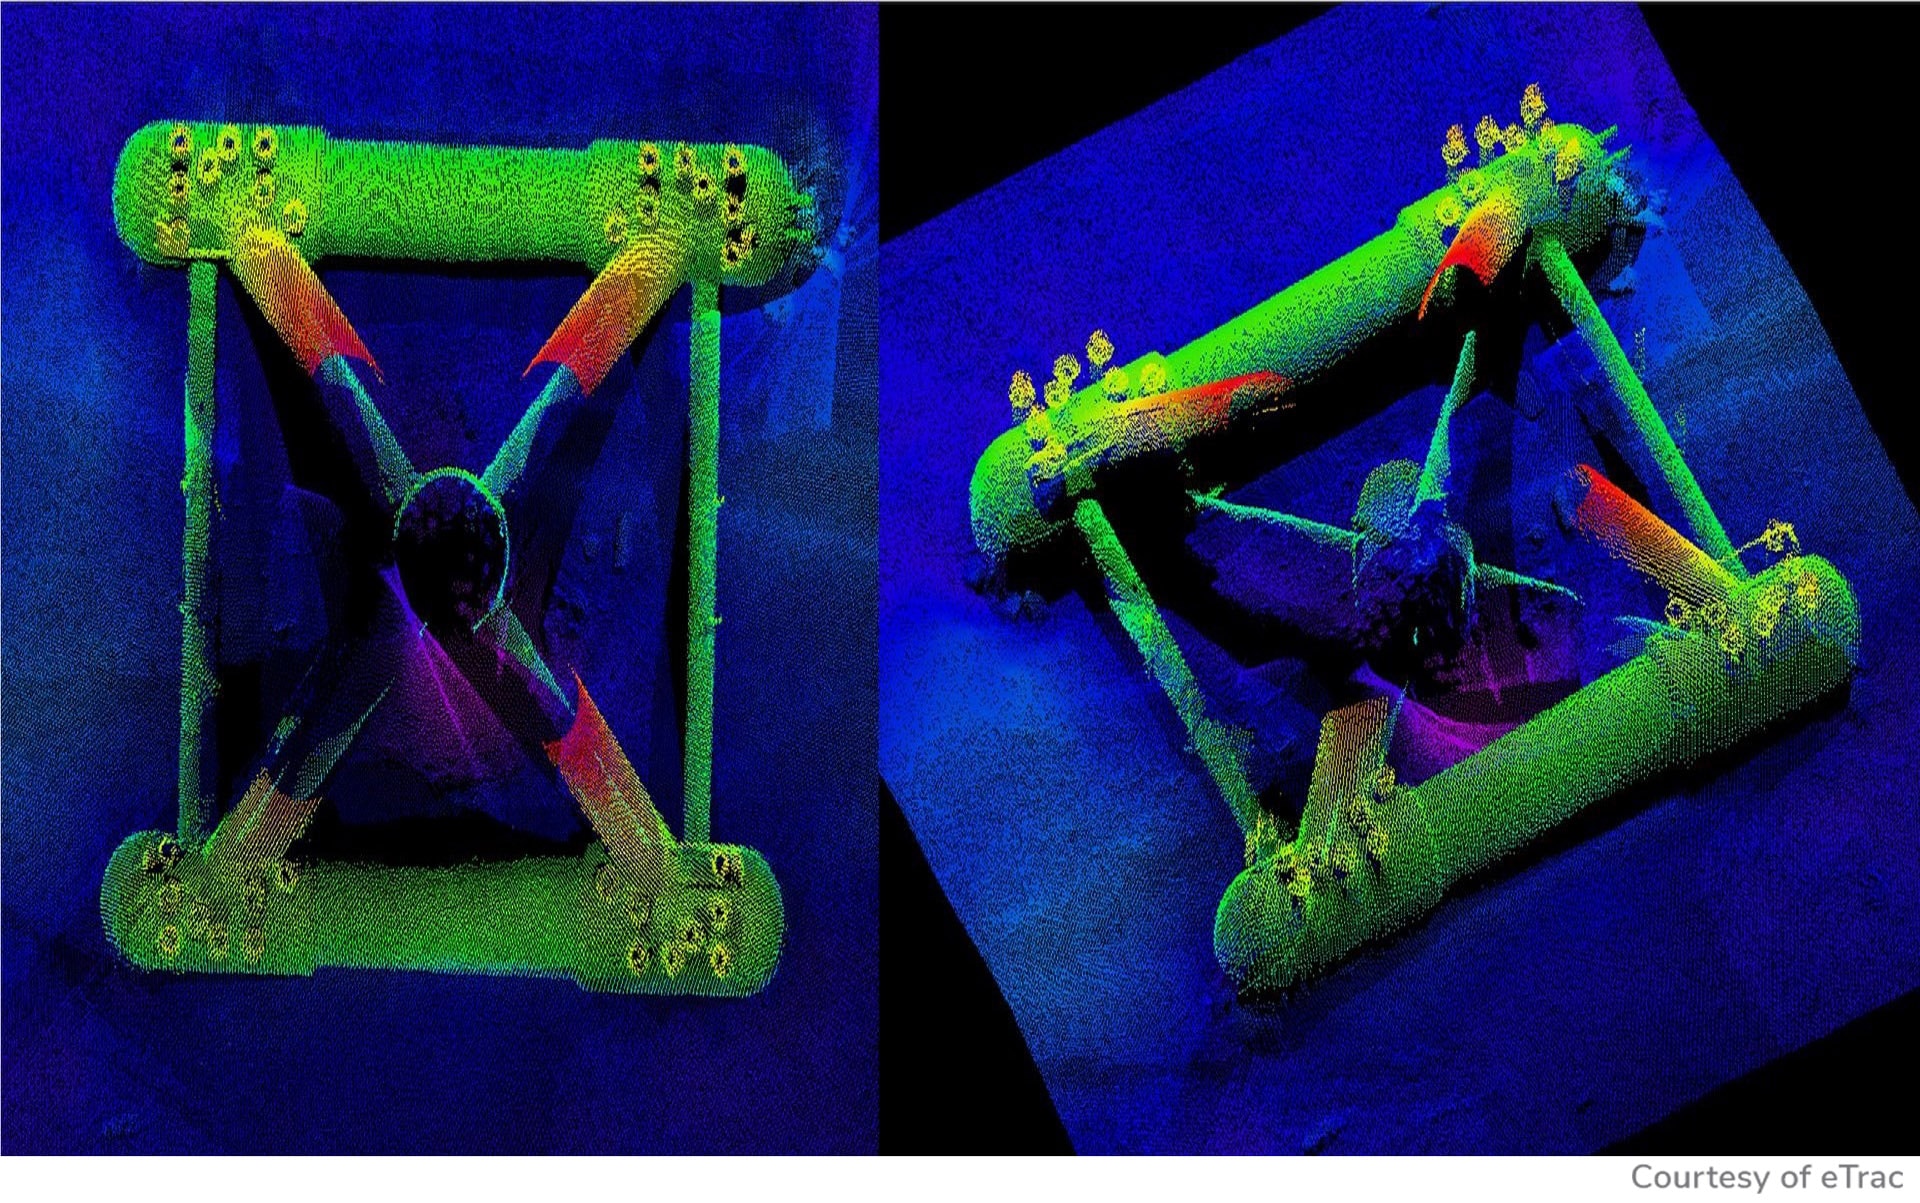
For many surveyors, post-processing is a time consuming and laborious process. Yet, with just a few adjustments to the way survey data are collected, it is possible to reduce the time spent cleaning and correcting data – improving efficiency, reducing frustration, and minimizing fixes.
Tips for collecting clean survey data
Maintain optimal power levels
- The first step towards obtaining clean survey data is to ensure that sufficient Total Power is going into the water. Having sufficient total power going into the water allows for keeping the receiver Gain low so as not to amplify noise in the water.
- Total Power is the combination of the source level (Power in Sonic Control) and the length of time the power is going into the water (Pulse Width in Sonic Control).
- N.B. if the source level (Power) is too high, there is a risk of nadir saturation (seen as a nadir track).
- To obtain the right balance in total power, the source level (Power) can be reduced, and the pulse width increased to put the reduced power into the water for a longer period of time, resulting in little change to the total power going into the water.
Monitoring and making adjustments
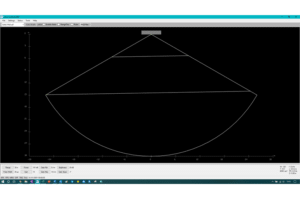
- Use the appropriate data collection software displays to monitor and quality control (Q.C.) data collection during the survey; displays provide enhanced views of sonar data to further assist if adjusting parameters in Sonic Control is required.
- Monitor Sonic Control regularly
- In Sonic Control, make sure that the Acoustic Image is enabled in Display Settings.
- Understand the relationship between Power, Gain, and Pulse Width. Only adjust one setting at a time and evaluate the change’s effect before making further changes. Many times, a single increase or decrease of a setting will be sufficient.
- The sonar uses Time Variable Gain (TVG). The main components of TVG are Absorption and Spreading Loss, both of which are adjusted in Sonic Control (Ocean Settings). Absorption is frequency, temperature, and salinity dependent and should be set for the survey environment. Spreading Loss should only be increased when surveying in deeper water; the default is 20dB, which is suitable for surveys in depths less than 35 meters.
- Always keep good survey logs!
Saturation Monitor
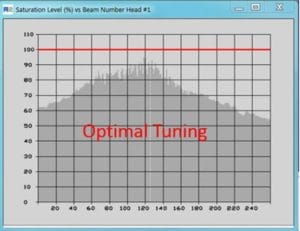
The Saturation Monitor (under Status, in Sonic Control) is a useful aid to assist in maintaining the correct balance of Power, Gain, and Pulse Width. The Saturation Monitor graphically shows the degree of receiver saturation or the degree of received acoustic intensity.
- N.B. any portion that crosses the 100% Saturation, as represented by a horizontal red line, indicates that the receiver is now in a saturated mode and in a nonlinear condition. In this saturated state, there is the possibility of a nadir track or disturbed soundings in the nadir region.
- Reducing the Power or the Gain will reduce the saturation level; Pulse Width may need to be increased to compensate for the reduction in Power.
In conclusion, the sonar’s proper tuning and monitoring during data collection will result in cleaner raw data, which will make a significant difference in post-processing.
By obtaining clean survey data, errors are reduced, data quality is improved, and time is saved in processing the data.
Check out the video How to Navigate the GUI which shows how to set up the sonar at first and how to calculate absorption.